Paint Solution
 Wall paint
친환경 벽지 페인트
Wall paint
친환경 벽지 페인트
What are you looking for?
- Suggested keywords
- #Aisaengkag # FLAMECHECK # EPOCOAT
- PRODUCT14 Types


- Home
- IR
- Financial Statements
Financial Statements
We create value for investors
with consistent and reliable returns.
Unit: KRW million
| Financial statements (consolidated) | 2023 | 2024 | 2025 | ||
|---|---|---|---|---|---|
| Assets | Current assets | 298,301 | 309,605 | 313,392 | |
| Non-current assets | 292,313 | 309,710 | 307,133 | ||
| Total assets | 590,614 | 619,315 | 620,525 | ||
| Debt | Current debt | 214,189 | 259,276 | 208,808 | |
| Non-current debt | 67,371 | 30,428 | 71,273 | ||
| Total debt | 281,560 | 289,704 | 280,081 | ||
| Capital | Capital from owner of parent company |
Capital | 13,602 | 13,602 | 13,602 |
| Other paid-in capital | 8,990 | 17,623 | 31,736 | ||
| Other components of capital | 998 | 5,299 | 5,224 | ||
| Retained earnings | 284,718 | 290,314 | 289,567 | ||
| Total capital attributable to owners of the parent company | 308,308 | 326,838 | 340,129 | ||
| Non-controlling interest | 746 | 2,773 | 315 | ||
| Total capital | 309,054 | 329,611 | 340,444 | ||
Unit: KRW million
| Income statements (consolidated) | 2023 | 2024 | 2025 |
|---|---|---|---|
| Sales revenue | 631,382 | 628,348 | 617,067 |
| Cost of sales | 498,952 | 504,445 | 477,887 |
| Selling and administrative expenses | 106,603 | 104,921 | 129,631 |
| Operating profit | 25,827 | 18,982 | 9,549 |
| Net profit before corporate tax expenses | 19,134 | 21,614 | 11,846 |
| Net profit for current period | 16,131 | 15,473 | 7,780 |
| Major financial ratios (standalone) | 2023 | 2024 | 2025 | |
|---|---|---|---|---|
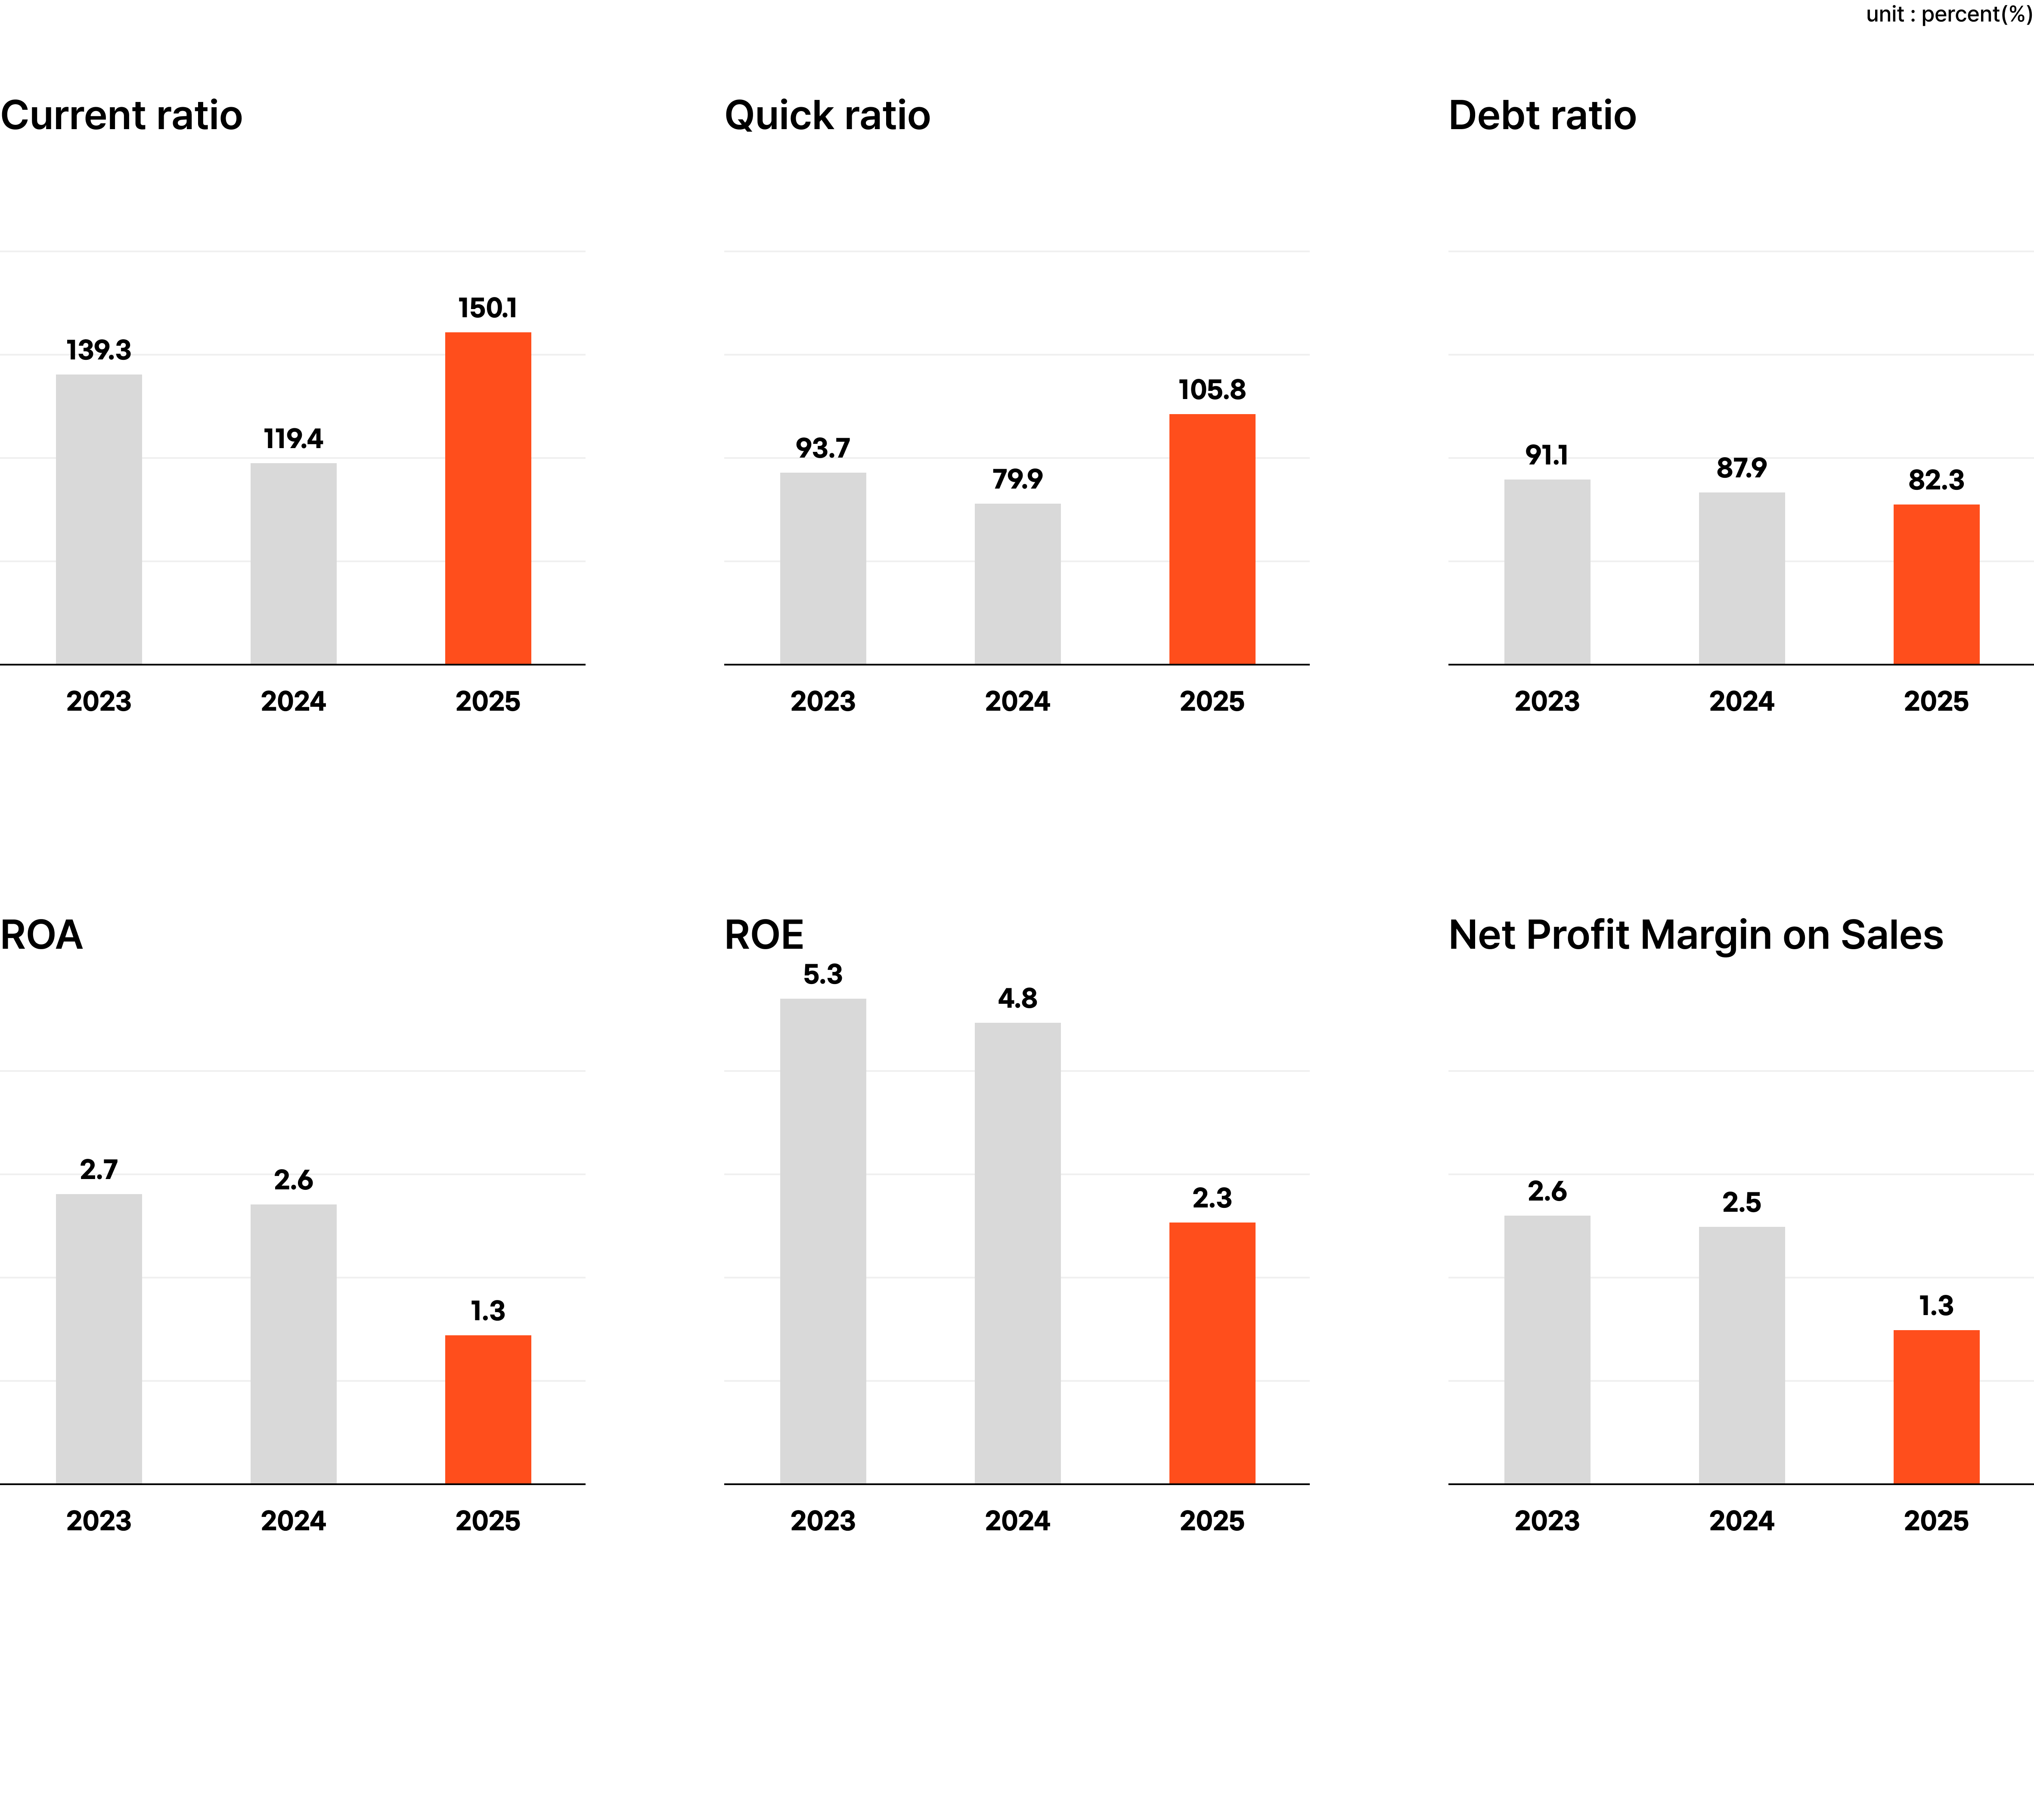
| Stability | Current ratio | 139.3% | 119.4% | 150.1% |
| Quick ratio | 93.7% | 79.9% | 107.6% | |
| Debt ratio | 91.1% | 87.9% | 82.3% | |
| Activity | Total Asset Turnover Ratio | 1.0 | 1.0 | 1.0 |
| Equity Turnover Ratio | 2.1 | 2.0 | 1.8 | |
| Accounts Receivable Turnover Ratio | 4.3 | 4.4 | 4.0 | |
| Profitability | ROA | 2.7% | 2.6% | 1.3% |
| ROE | 5.3% | 4.8% | 2.3% | |
| Net Profit Margin on Sales | 2.6% | 2.5% | 1.3% | |
| Growth | Sales Growth Rate | -2.3% | -0.5% | -1.8% |
| Net Profit Growth Rate | 193.4% | -4.1% | -49.7% | |
| Stock-related Ratios | EPS | 685 | 654 | 286 |
| PER | 9.7 | 9.4 | 16.7 | |
| Dividend status | 2021 | 2022 | 2023 | 2024 | 2025 |
|---|---|---|---|---|---|
| Dividend type | Cash dividend | Cash dividend | Cash dividend | Cash dividend | Cash dividend |
| Dividend per share (KRW) | 100 | 250 | 400 | 350 | 200 |
| Market dividend rate (%) | 1.2% | 4.1% | 5.9% | 5.3% | 4.2% |
| Total dividend (KRW million) | 2,359 | 5,898 | 9,436 | 8,685 | 4,814 |
| Consolidated dividend payout ratio (%) | -96.4% | 105.3% | 58.4% | 56.2% | 64.9% |
| Consolidated net profit for controlling interest (KRW million) | -2,448 | 5,601 | 16,162 | 15,465 | 7,418 |
| Standalone dividend payout ratio (%) | -35.3% | 115.1% | 46.0% | 56.7% | 201.5% |
| Standalone net profit (KRW million) | -6,692 | 5,124 | 20,528 | 15,328 | 2,389 |
| Rating agency | 2020 | 2021 | 2022 | 2023 | 2024 |
|---|---|---|---|---|---|
| NICE Investors Service | BBB+ (Stable) |
BBB+ (Stable) |
BBB+ (Stable) |
BBB+ (Stable) |
- |
| Korea Ratings | BBB+ (Stable) |
- | - | - | - |
| KIS Rating | BBB+ (Stable) |
- | - | - | - |
| Grades | Definition of grades | |
|---|---|---|
| "A" grades | AAA | Topnotch ability to pay principal and interest. |
| AA | Very able to pay principal and interest, but not as good as AAA. | |
| A | Quite able to pay principal and interest, but may be more vulnerable than businesses in the other two A grades to changes in economic and business conditions. | |
| "B" grades | BBB | Decent ability to pay principal and interest, but this may decline in the future, relative to businesses in higher grades, when economic and business conditions change. |
| BB | Able to pay principal and interest for now, but future security remains speculative. | |
| B | Lacks ability to ensure consistent payment of principal and interest, is already speculative, and cannot guarantee ability to pay interest when economic and business conditions worsen. | |
| "C" grades | CCC | Already shows signs of uncertainty over ability to pay principal and interest now, and is highly speculative (with a significant risk of default). |
| CC | Shows even more signs of uncertainty and default than businesses rated CCC. | |
| C | Carries a high risk of default and currently has no ability to pay either principal or interest. | |
| "D" grades | D | Currently in default. |
Financial Statements
We create value for investors
with consistent and reliable returns.
with consistent and reliable returns.
Balance Sheet (consolidated)
(KRW million)
| 2023 | 2024 | 2025 | |
|---|---|---|---|
| Current assets | 298,301 | 309,605 | 310,740 |
| Non-current assets | 292,313 | 309,710 | 301,618 |
| Total assets | 590,614 | 619,315 | 612,358 |
| Current debt | 214,189 | 259,276 | 207,040 |
| Non-current debt | 67,371 | 30,428 | 69,242 |
| Total debt | 281,560 | 289,704 | 276,282 |
| Capital from owner of parent company | 308,308 | 326,838 | 333,124 |
| Capital | 13,602 | 13,602 | 13,602 |
| Other paid-in capital | 8,990 | 17,623 | 17,628 |
| Other components of capital | 998 | 5,299 | 8,917 |
| Retained earnings | 284,718 | 290,314 | 292,977 |
| Non-controlling interest | 746 | 2,773 | 2,952 |
| Total capital | 309,054 | 329,611 | 336,076 |
Income statements(consolidated)
(KRW million)
| 2023 | 2024 | 2025 | |
|---|---|---|---|
| Sales revenue | 631,382 | 628,348 | 617,067 |
| Cost of sales | 498,952 | 504,445 | 496,645 |
| Selling and administrative expenses | 106,603 | 104,921 | 107,461 |
| Operating profit | 25,827 | 18,982 | 9,549 |
| Net profit before corporate tax expenses | 19,134 | 21,614 | 12,170 |
| Net profit for current period | 16,131 | 15,473 | 7,796 |
Major financial ratios (consolidated)
| 2023 | 2024 | 2025 | |
|---|---|---|---|
| Stability | |||
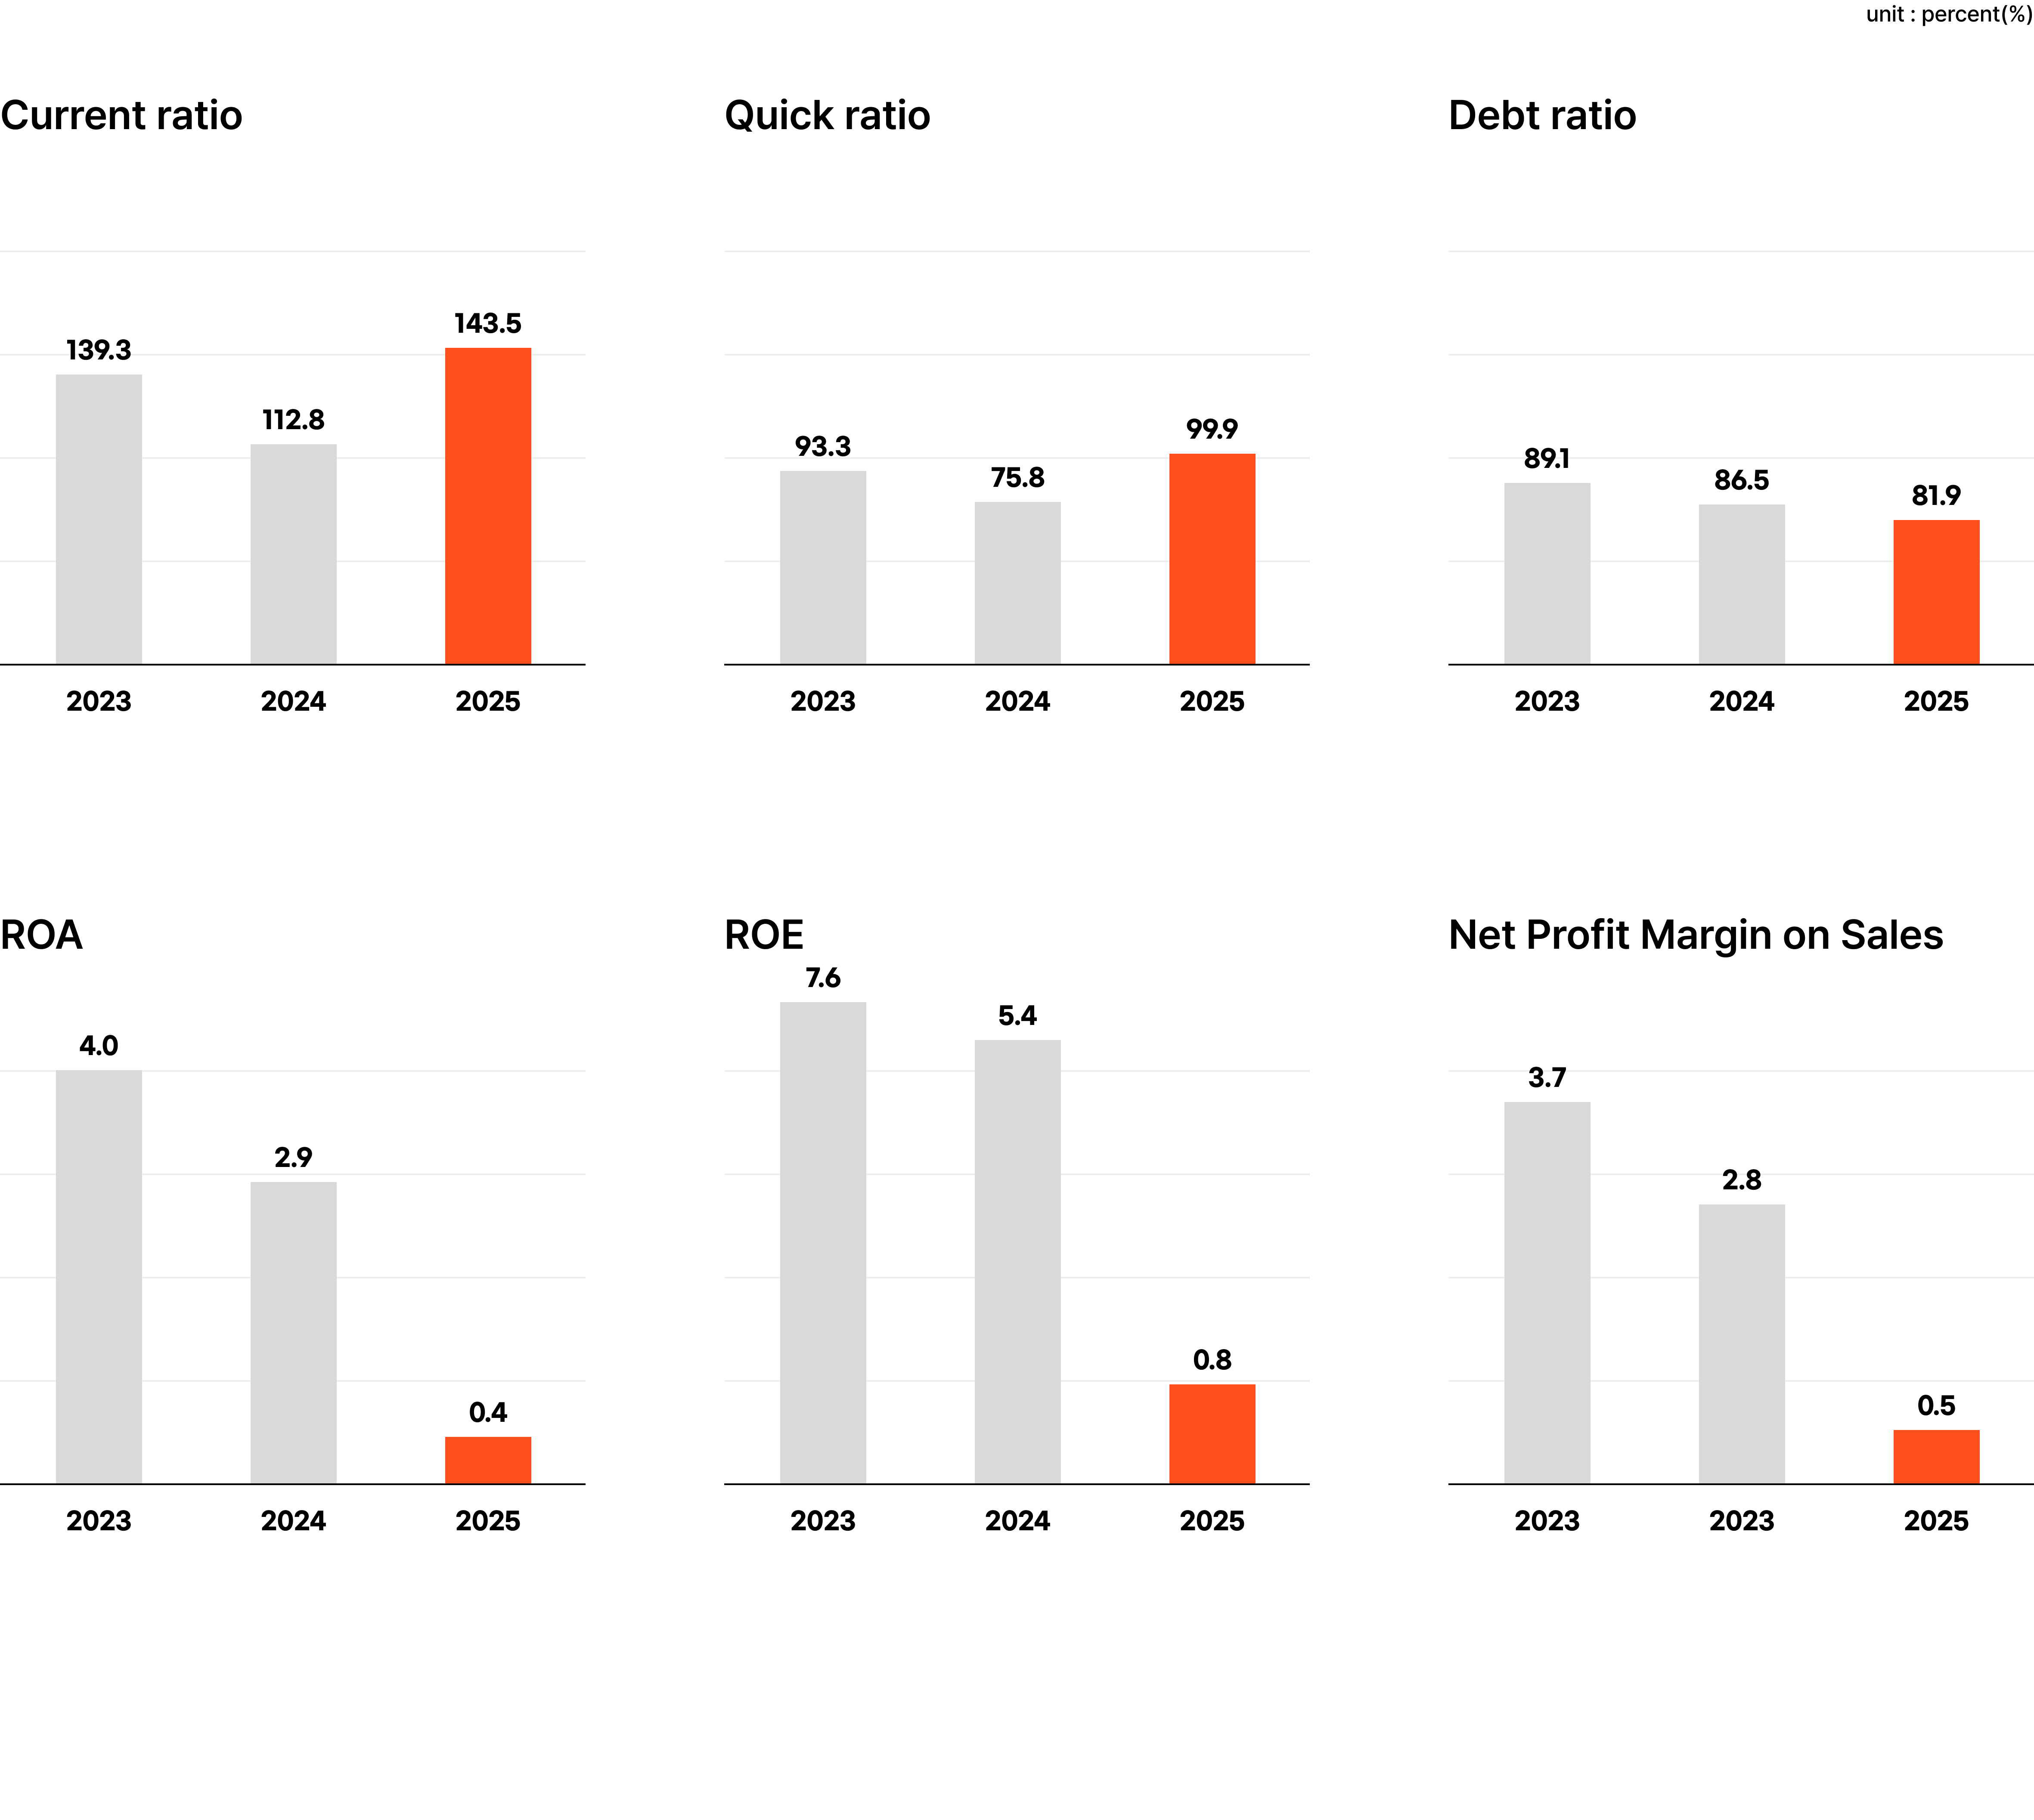
| Current ratio | 139.3% | 119.4% | 150.1% |
| Quick ratio | 93.7% | 79.9% | 107.6% |
| Debt ratio | 91.1% | 87.9% | 82.3% |
| Activity | |||
| Total Asset Turnover Ratio | 1.0 | 1.0 | 1.0 |
| Equity Turnover Ratio | 2.1 | 2.0 | 1.8 |
| Accounts Receivable Turnover Ratio | 4.3 | 4.4 | 4.0 |
| Profitability | |||
| ROA | 2.7% | 2.6% | 1.3% |
| ROE | 5.3% | 4.8% | 2.3% |
| Net Profit Margin on Sales | 2.6% | 2.5% | 1.3% |
| Growth | |||
| Sales Growth Rate | -2.3% | -0.5% | -1.8% |
| Net Profit Growth Rate | 193.4% | -4.1% | -49.7% |
| Stock-related Ratios | |||
| EPS | 685 | 654 | 286 |
| PER | 9.7 | 9.4 | 16.7 |